python性能分析方法 作者: ciniao 时间: 2018-06-29 分类: 技术 * 本文发布时间较久,请自行判断有效性 ####基于指定函数或指定文件侵入式分析 cProfile:基于lsprof的用C语言实现的扩展应用,运行开销比较合理,适合分析运行时间较长的程序,推荐使用这个模块; 使用cProfile进行性能分析,你可以在Python脚本中实现,也可以使用命令行执行: ``` if __name__ == "__main__": import cProfile # 直接把分析结果打印到控制台 cProfile.run("test()") # 把分析结果保存到文件中 cProfile.run("test()", filename="result.out") # 增加排序方式 cProfile.run("test()", filename="result.out", sort="cumulative") ``` 使用命令行运行的方法基本一致,Bash代码如下: ``` # 直接把分析结果打印到控制台 python -m cProfile test.py # 把分析结果保存到文件中 python -m cProfile -o result.out test.py # 增加排序方式 python -m cProfile -o result.out -s cumulative test.py ``` 也可直接对代码段进行分析: ``` import cProfile, pstats, StringIO pr = cProfile.Profile() pr.enable() #需要调试的代码段 pr.disable() s = StringIO.StringIO() ps = pstats.Stats(pr, stream=s).sort_stats('cumulative') ps.print_stats() print s.getvalue() #或 from cProfile import Profile def runRe(): import re re.compile("aaa|bbb") prof = Profile() prof.enable() runRe() prof.create_stats() prof.print_stats() ``` <!--more--> 结果类似: ``` 8 function calls in 0.042 seconds Ordered by: cumulative time ncalls tottime percall cumtime percall filename:lineno(function) 1 0.000 0.000 0.042 0.042 test.py:5(<module>) 1 0.002 0.002 0.042 0.042 test.py:12(test) 2 0.035 0.018 0.039 0.020 test.py:5(sum_num) 3 0.004 0.001 0.004 0.001 {range} 1 0.000 0.000 0.000 0.000 {method 'disable' of '_lsprof.Profiler' objects} ``` 其中,输出每列的具体解释如下: ``` ncalls:表示函数调用的次数; tottime:表示指定函数的总的运行时间,除掉函数中调用子函数的运行时间; percall:(第一个percall)等于 tottime/ncalls; cumtime:表示该函数及其所有子函数的调用运行的时间,即函数开始调用到返回的时间; percall:(第二个percall)即函数运行一次的平均时间,等于 cumtime/ncalls; filename:lineno(function):每个函数调用的具体信息; ``` ####生产环境非侵入式性能分析利器 py-spy py-spy是一个非常好用而且简单的库,这个工具一是可以生成profile 火焰图,二是可以定位到程序中最耗时间的代码的位置。它的优点在于完全不用修改代码,相比较其他的一些性能调查工具,py-spy这一点非常棒,当你debug 一个线上正在运行的程序的时候,只需要提供进程id,py-spy 就可以直接生成火焰图。 github:https://github.com/benfred/py-spy 安装: ``` pip install py-spy ``` 其他平台的安装方式 ``` #MAC brew install py-spy #Arch Linux yay -S py-spy #Alpine Linux apk add py-spy --update-cache --repository http://dl-3.alpinelinux.org/alpine/edge/testing/ --allow-untrusted ``` record: ``` py-spy record -o profile.svg --pid 12345 #or py-spy record -o profile.svg -- python myprogram.py # py-spy record --help 可查看更多帮助 # 如每秒采样1000次,持续60秒: py-spy record -o profile.svg --pid 24206 -r 1000 -d 60 ``` 记录完成后,可得到如下图的火焰图: 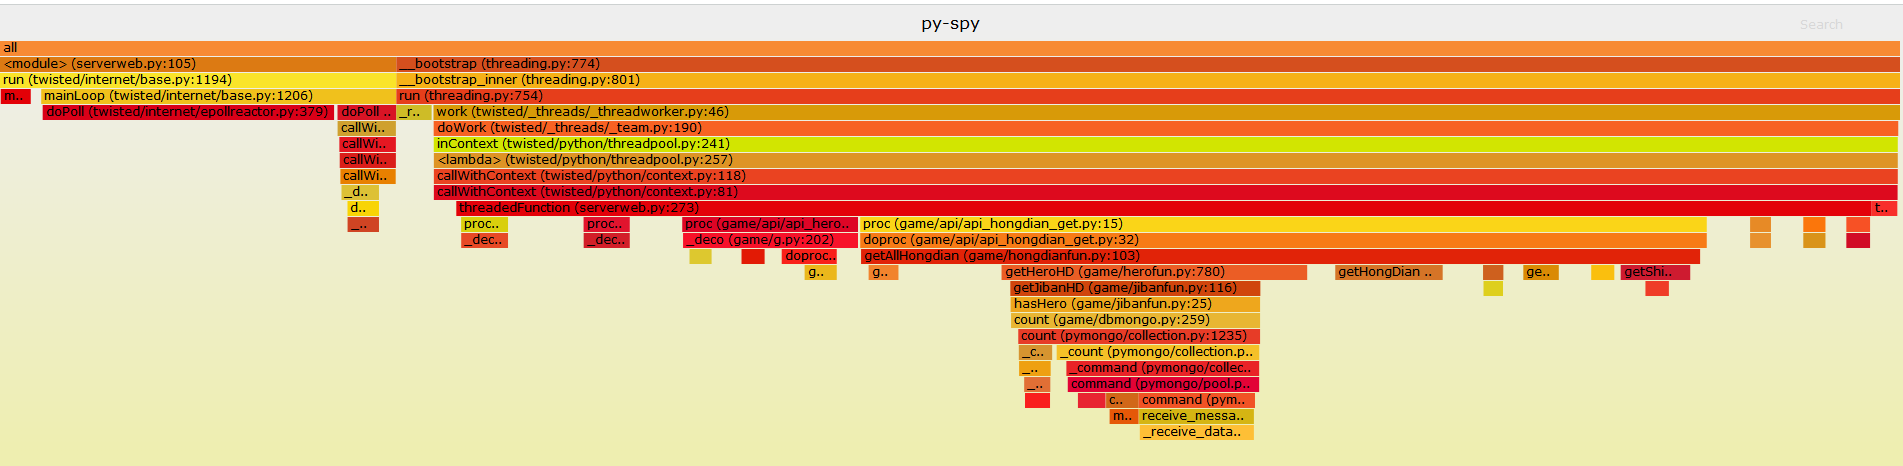 火焰图的分析非常简单直观,主要是看【平顶】,看图中最下方那个峰顶是平的,那么程序的性能问题就可以从这里入手去解决。 没有平顶情况下,定位程序中耗时最多函数/代码,这时候要用到py-spy 提供的 top 命令: ``` py-spy top --pid 12345 # OR py-spy top -- python myprogram.py ``` 输入上述命令后,在控制台会显示程序实时的运行状态,这里可以介绍一下图中4个参数的含义, 然后可以通过按1,2,3,4 四个按键,让程序按照下图所述排序。 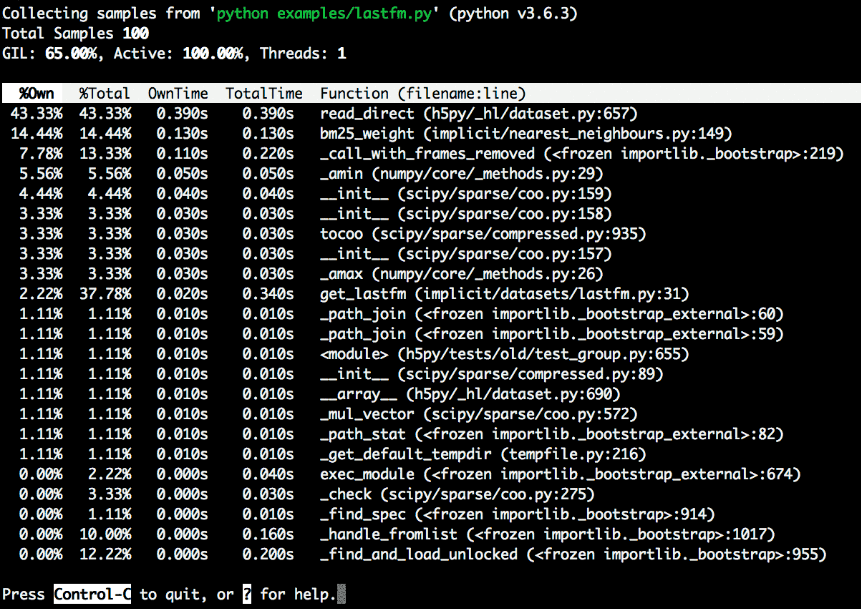 ``` 1按%Own排序(当前在该函数中花费的时间的百分比) 2按%Total排序(函数及其子级中当前的时间百分比) 3按OwnTime排序(函数中花费的总时间) 4按TotalTime排序(该函数及其子项花费的总时间) ``` 比较直观的 使用3 , 可以比较直接的看出程序运行中,所占比消耗时间最多的函数 标签: python
 刺鸟的荆棘树
评论已关闭